
Take your map visualizations to the next level.
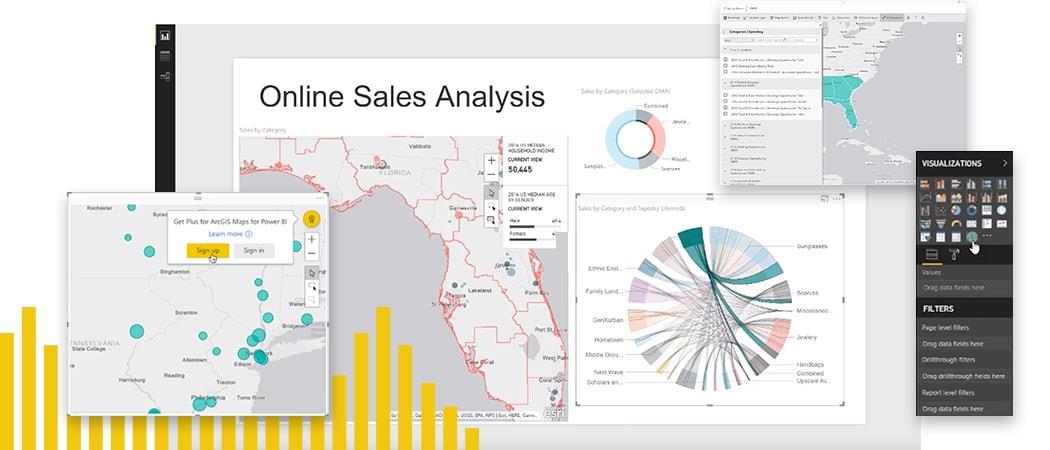
Unlock the power of location in your business intelligence. With ArcGIS Maps for Power BI, available inside Microsoft Power BI, create beautiful map visualizations that surface patterns and trends in your data. Gain context with ArcGIS maps and demographic data. Make better business decisions with ArcGIS for Power BI, available now at no cost.
Make maps, make good decisions

Get serious with map visualizations
Smart mapping helps you choose the right style and display for your data so you can make your most powerful business case. Visualize your data as points, areas, or clusters, and use the best background to let your data tell its story.

Give context to data
Leverage curated, ready-to-use data from ArcGIS to give perspective to your maps. Select from hundreds of demographic and reference layers such as income, population, or weather. Add this global content to analyze your data spatially in relation to other critical variables.

Accurate spatial analysis
Map any location value—an address, city, state, zip code, place name, boundary, or latitude and longitude. Make sense of your data by applying simple spatial analysis tools such as heat maps and drive times. Use maps to quickly expose relationships and patterns that impact decision-making.
How it works
Take your map visualizations to the next level.
Unlock the power of location in your business intelligence. With ArcGIS Maps for Power BI, available inside Microsoft Power BI, create beautiful map visualizations that surface patterns and trends in your data. Gain context with ArcGIS maps and demographic data. Make better business decisions with ArcGIS for Power BI, available now at no cost.
Make maps, make good decisions
Get serious with map visualizations
Smart mapping helps you choose the right style and display for your data so you can make your most powerful business case. Visualize your data as points, areas, or clusters, and use the best background to let your data tell its story.
Give context to data
Leverage curated, ready-to-use data from ArcGIS to give perspective to your maps. Select from hundreds of demographic and reference layers such as income, population, or weather. Add this global content to analyze your data spatially in relation to other critical variables.
Accurate spatial analysis
Map any location value—an address, city, state, zip code, place name, boundary, or latitude and longitude. Make sense of your data by applying simple spatial analysis tools such as heat maps and drive times. Use maps to quickly expose relationships and patterns that impact decision-making.
How it works