Electric
Geometric Networks
with ArcMap offer a way to model common networks
and infrastructures found in the real world.
GIS gives utilities an advantage
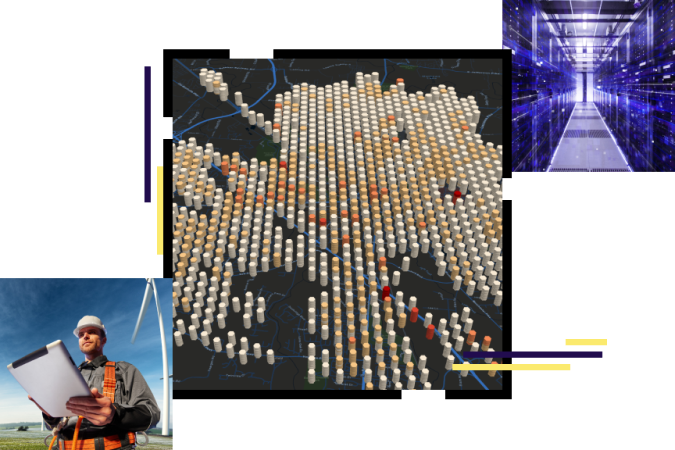
Location is fundamental to all electric and gas utilities. Empower staff to leverage critical location data with ArcGIS technology. Advanced mapping and real-time spatial analytics in ArcGIS strengthen operations and decision-making—from the field to the office.
Access
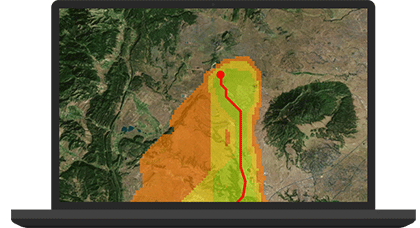
Connect everyone with maps and data. See assets, plans, compliance issues, and high-demand areas in one place to improve operations.
Awareness
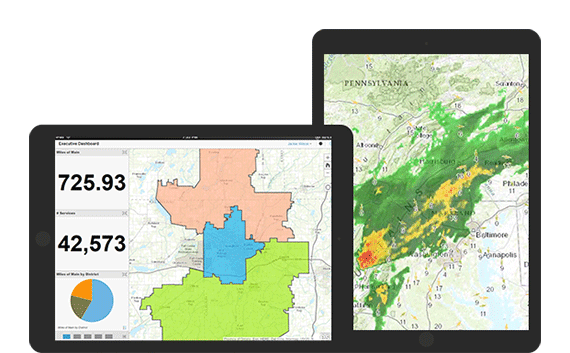
Keep a pulse on real-time weather, traffic, asset, and disaster information to speed response times.
Analytics
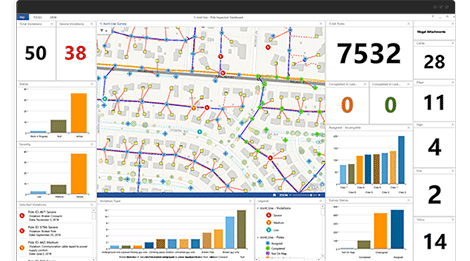
Reveal relationships in your data, such as areas of high usage that are vulnerable to disasters. Detect problems before they occur.
EXPLORE A REAL-LIFE SCENARIO
As a powerful storm approaches, managers assess network vulnerability.
Utility staff need to accurately identify locations where the network is most at risk of outages before high winds and lightning strike. Looking at outage and tree-trimming history on a map, they see the areas prone to outages and those where overgrown trees could damage power lines.
EXPLORE A REAL-LIFE SCENARIO
Real-time maps help staff pinpoint outstanding maintenance tickets.
Network managers map the utility's open work orders to understand where they need to fix critical maintenance issues. Seeing where orders exist in the network provides more data that can be used when prioritizing efforts ahead of the storm.
EXPLORE A REAL-LIFE SCENARIO
The team analyzes data to accurately determine high-risk areas.
A heat map incorporates historic outage and tree-trimming information with work order data to show exactly where the network is most vulnerable to outages. Using insight derived from spatial analysis, staff prepare a plan to get ahead of the storm.
EXPLORE A REAL-LIFE SCENARIO
Crews deploy to areas of greatest need.
Real-time information, including authoritative company data and a real-time weather feed, drives work orders and tree-trimming prioritization. Managers dispatch crews to work in critical areas in advance of the storm.
EXPLORE A REAL-LIFE SCENARIO
The lights stay on during the storm.
Acting fast to close maintenance tickets and trim overgrown limbs sets the utility up for success. Compared to past storms, it reduces customer outage hours, the number of customers impacted, and staff overtime expenses.
Case Study
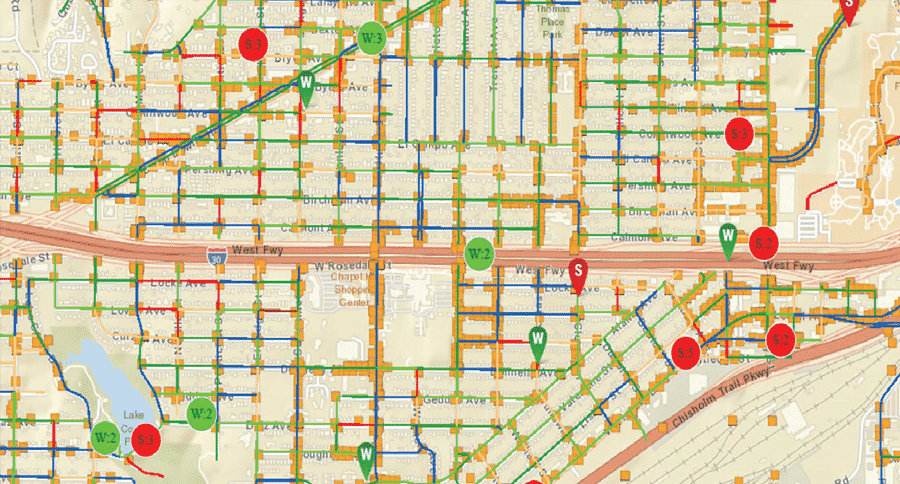
Moving from Reactive to Proactive Management
The City of Fort Worth, Texas, makes smarter decisions based on known asset conditions as a result of its extensive use of digital processes.
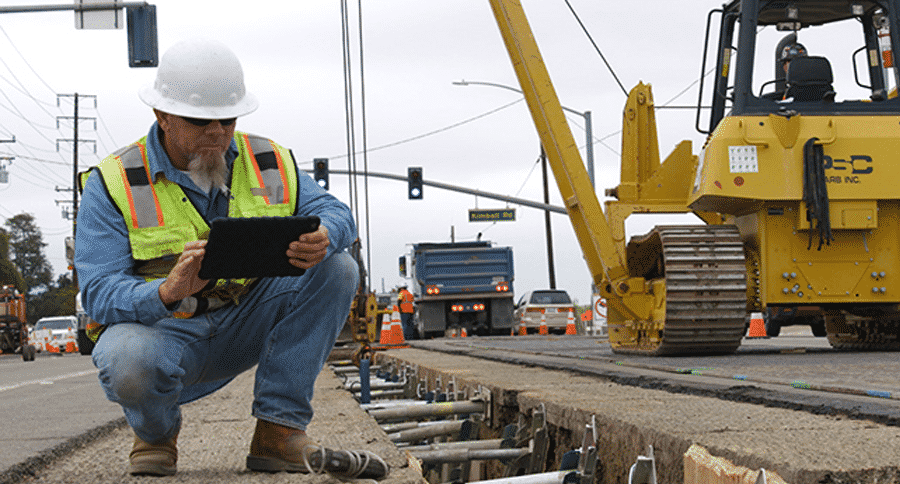
SoCalGas Facing Natural Disaster With Technology
how SoCalGas, the nations largest gas utility company, uses ArcGIS Enterprise to respond quickly to gas pipeline emergencies caused by natural disasters.
Related
Geometric Networks
with ArcMap offer a way to model common networks
and infrastructures found in the real world.
GIS gives utilities an advantage
Location is fundamental to all electric and gas utilities. Empower staff to leverage critical location data with ArcGIS technology. Advanced mapping and real-time spatial analytics in ArcGIS strengthen operations and decision-making—from the field to the office.
Access
Connect everyone with maps and data. See assets, plans, compliance issues, and high-demand areas in one place to improve operations.

Awareness
Keep a pulse on real-time weather, traffic, asset, and disaster information to speed response times.

Analytics
Reveal relationships in your data, such as areas of high usage that are vulnerable to disasters. Detect problems before they occur.

EXPLORE A REAL-LIFE SCENARIO
As a powerful storm approaches, managers assess network vulnerability.
Utility staff need to accurately identify locations where the network is most at risk of outages before high winds and lightning strike. Looking at outage and tree-trimming history on a map, they see the areas prone to outages and those where overgrown trees could damage power lines.
EXPLORE A REAL-LIFE SCENARIO
Real-time maps help staff pinpoint outstanding maintenance tickets.
Network managers map the utility's open work orders to understand where they need to fix critical maintenance issues. Seeing where orders exist in the network provides more data that can be used when prioritizing efforts ahead of the storm.
EXPLORE A REAL-LIFE SCENARIO
The team analyzes data to accurately determine high-risk areas.
A heat map incorporates historic outage and tree-trimming information with work order data to show exactly where the network is most vulnerable to outages. Using insight derived from spatial analysis, staff prepare a plan to get ahead of the storm.
EXPLORE A REAL-LIFE SCENARIO
Crews deploy to areas of greatest need.
Real-time information, including authoritative company data and a real-time weather feed, drives work orders and tree-trimming prioritization. Managers dispatch crews to work in critical areas in advance of the storm.
EXPLORE A REAL-LIFE SCENARIO
The lights stay on during the storm.
ดActing fast to close maintenance tickets and trim overgrown limbs sets the utility up for success. Compared to past storms, it reduces customer outage hours, the number of customers impacted, and staff overtime expenses.
Case Study

Moving from Reactive to Proactive Management
The City of Fort Worth, Texas, makes smarter decisions based on known asset conditions as a result of its extensive use of digital processes.

SoCalGas Facing Natural Disaster With Technology
how SoCalGas, the nations largest gas utility company, uses ArcGIS Enterprise to respond quickly to gas pipeline emergencies caused by natural disasters.

