
07 Apr Empowering Water Utilities with Location Intelligence
Digital transformation is making water utilities leaner and smarter. Sensor networks and the Internet of Things provide real time information that helps utilities manage water loss, identify water quality issues, and more. Intelligent analytics uses data to predict water supply and consumer demand so that water managers can scientifically plan sustainable communities. Many utilities already use ArcGIS® to map the location of pipes, valves, pumps, meters, and other assets.
ArcGIS® drives water service analysis. You need to understand problems before attempting to solve them. Water engineers, treatment plant and system operators, and water authority administrators can easily use ArcGIS spatial analysis tools. ArcGIS not only maps assets, but it also broadens operational awareness by integrating customer, climate, and other datasets with your agency’s own data. Explore a variety of geospatial data and transform it into actionable intelligence. You can use ArcGIS Insights to identify patterns and trends by looking deeper into data collected during fire hydrant flushing. Staff reviewed flow data from hydrants to identify areas where recorded flows were below the desirable PSI. Low-flow areas were then evaluated in conjunction with water mains, revealing that some low flows were within new construction areas. By performing this comparison, staff were able to identify areas that should be prioritized for leak investigation. This resulted in saved labor by mobilizing teams and equipment in focused areas of concern.
Question: Where are my main breaks located?
ArcGIS helps you easily visualize data as a map to recognize data patterns, groupings, and anomalies that lead to deeper questions about what is happening. Spatial analysis tools allow you to dive deeper into your data to answer these questions. ArcGIS Insights is an analytics workbench that uses the power of geography to explore and analyze your data. For instance, it allows you to cluster incident data and calculate frequency density to reveal patterns.
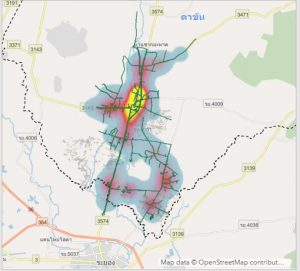
Figure 1 show simple heat map that identifies areas where breaks are most frequent.
Question: How do I locate and isolate the main break and determine its impact?
You need to know which valves will isolate a problem? The Network Analysis tool finds changes to the network isolation trace. This trace capability also identifies which customers and hydrants will be out of service The analysis allows you to quickly respond to breaks, dispatch crews, and notify customers.
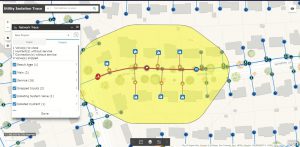
Figure 2 shows the network analysis system that show the affected area.
What to get more detail for Water Utility Solution?, please visit our website Empowering Water Utilities with Business Intelligence ebook | How to make data-driven decisions with analytics (esri.com) or Call us at (+66) 02-678 0212
Unleashing GIS Technology’s potential in every industries