

03 Jul University of Maryland Students Develop Interactive Site with Web App Tool to Improve Cyclist Safety in Prince George’s County
The Office of Planning and Capital Programming at the Maryland Department of Transportation (MDOT)—in cooperation with state, regional, and local agencies and residents—works to plan, program, and develop a balanced transportation system. This work includes addressing bike and pedestrian access issues. As part of its mission to maintain safe roadways, MDOT wanted to examine the level of traffic stress (LTS) throughout the state. The LTS rating of a road segment or crossing indicates the traffic stress it imposes on bicyclists.
According to Nate Evans, a transportation planner for MDOT, a lot of existing state infrastructure was not necessarily geared toward cyclists of all abilities. As such, the data collected for this LTS project would help inform recommendations to MDOT, such as adding shared-use bike paths or protected bike lanes, to see where safety improvements can be made.
Andrew Bernish—a geographic information system (GIS) planner for consulting company KFH Group, which works with MDOT—previously, some counties and jurisdictions had their own reliable data while other counties did not. Thus, MDOT developed an authoritative dataset for the entire state by calculating an LTS score for each roadway segment throughout Maryland.
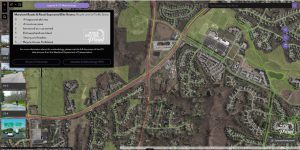
The Prince George’s County Level of Bicycle Traffic Stress application includes areas where bicycling infrastructure is already in place.
A PALS Partnership
Bernish saw a unique opportunity for the small group of students in a class he was teaching, Recent Developments in Urban Studies: Intermediate Geographic Information Systems. The Parks and Recreation Department of Prince George’s County put in a request to UMD’s Partnership for Action Learning in Sustainability (PALS) program to create a bike stress map.
PALS is a campus-wide program designed to provide high-quality, low-cost assistance to local governments and real-world learning experiences for UMD students. Kimberly Fisher, PALS program director, asked Bernish if he would be interested in any of the available county projects, and he knew the stress map would be the perfect student project because of the recently completed dataset.
The county wanted the map for staff and residents to see the county bike network. Fisher says the partnership will help the county make roads safer.
Site Building Blocks
To begin creating the bike stress map, Bernish selected ArcGIS Experience Builder, which he felt was a straightforward and user-friendly solution that would provide a more interactive experience for users than other web applications. ArcGIS Experience Builder allows users to create web apps that integrate their maps and data with flexible layouts and drag-and-drop widgets. Bernish had prior experience with different web application builders but chose Experience Builder because it offered more visually compelling graphics, was immersive, and provided a more seamless experience.
“Experience Builder uses more up-to-date JavaScript and it runs a little easier. It’s easier to manipulate for mobile applications. But also, I really like it for the students’ learning because you can easily and intuitively add so many different widgets and features,” says Bernish. “I’ve used it before and I thought the students would benefit from learning it.”
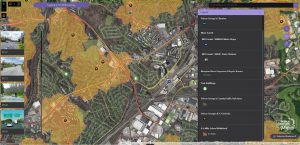
An area within Prince George’s County that illustrates both heavier automobile traffic and thus a higher bicycle level of traffic stress (LTS 4 – shown in red) along with suburban areas of low traffic stress and Road Separated Bicycle routes (shown in two shades of green corresponding to LTS 1 and 0) weaving through county park areas.
Jeff DelMonico, a community planning specialist for the Howard County Department of Planning and Zoning, was a student in the class. DelMonico says the class covered a range of subjects including geodatabase design, web map development in ArcGIS Online, scripting in Python, and ArcGIS Pro tutorials to ultimately create the application.
In addition to the physical development of the application, one of the key parts of the project was determining what’s relevant for the LTS map to display. DelMonico says the class decided to communicate the specific types of traffic stress by using images and explaining—with minimal text—what each LTS score means. The students also discussed what information might be relevant to cyclists—for example, not just showing the bike path or road but also high-frequency destinations like parks and public schools or where bike-share locations are. DelMonico says he found this to be a valuable learning experience because it demonstrated to the students just how useful GIS can be in a real-world planning situation.
The Final Result
The bike stress map and site was officially released in May 2022 and recent metrics from the university show more than 2,000 hits. Bernish describes the site as a mapcentric application. It lets the students highlight a large amount of data, which had recently been released by the state, on one online site, allowing for easy updates. Experience Builder enabled the student team to customize the site by adding images and features like a button to download data. External users can also easily share the link to the site.
The map shows the LTS on roads throughout Prince George’s County and allows users to perform searches by address or bike trail name. The map also shows road-separated bike routes—facilities for bicyclists’ exclusive use that are located adjacent to a roadway, as well as more traditional trails, such as former rail right-of-way easements that have been converted into trails.
“The users can be a little bit more engaged and active in it. We tried to make it more user-friendly for folks that are not GIS savvy,” says Bernish. “I really like the ease with which you can turn on and off different layers. It’s simplistic and easy for the students to use.”
DelMonico explains that the ability to add customizable widgets to the site let them convey the different LTS levels in a “visually pleasing way.” The students decided to use a bookmark widget that lets users click on an LTS score to turn the individual LTS layers on or off in the interactive map. Customized buttons were placed within the map application to provide additional information to users should they need it. For LTS scores 0–5, the lower the number, the better the biking conditions are, says Evans.
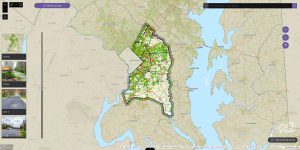
The Prince George’s County Level of Bicycle Traffic Stress application’s home where users can explore roads and trails for bicycling with various levels of bicycle traffic stress symbolized.
“All throughout the development, I found Experience Builder to be effective and intuitive. For example, creating a splash screen to provide a brief overview of the application took only minutes to design. Developing widgets, which were programmed specifically to accomplish customized tasks, was similarly unambiguous,” says DelMonico. “In the end, I enjoyed my first experience with Experience Builder.”
DelMonico adds that the student group also used ArcGIS StoryMaps to create a website detailing the story behind LTS methodologies. ArcGIS StoryMaps is an application that lets users combine authoritative maps with narrative text, images, and multimedia content. Because the site involves elements key to community planning, DelMonico brought the project to the attention of his current colleagues. “The students not only practiced their GIS skills with the map, but they also worked on how to present information for an informed audience and the general public,” says Fisher. “The project was very successful, and a second project using newly developed network capabilities will take place this spring.”
Unleashing GIS Technology’s potential in every industries