

01 Oct When Tornadoes Hit Tallahassee, AI Maps the Damage in Days Instead of Months
When Tornadoes Hit Tallahassee, AI Maps the Damage in Days Instead of Months
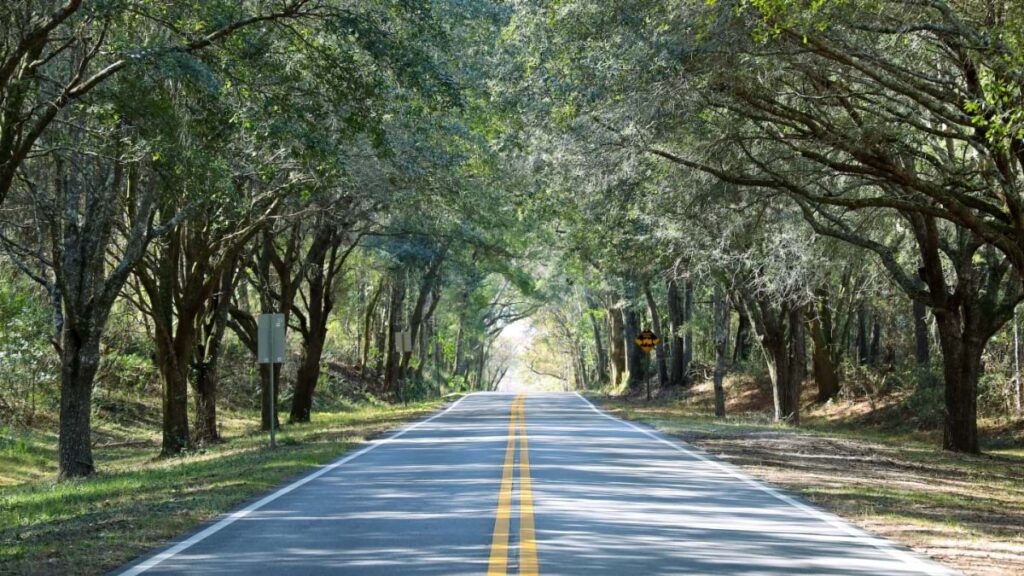
Tallahassee’s story begins with its trees. Shaded tunnels lined with moss-draped live oaks, sweet gums, and hickories trace centuries of history from pre-Colombian trails to Spanish missions and antebellum plantations.
Storms—hurricanes and tornados—take their toll on this green crown. When severe weather hits, public works crews with the city and county follow close behind to start repairs. But manual inspections can take weeks, even months, to assess the damage. Conventional aerial image analysis and hand digitization is not much faster.
Recently, Jason Cox, a systems analyst with Tallahassee Leon County geographic information system (GIS) department (TLCGIS), developed a new technique to expedite tree restoration. He uses AI models in GIS to detect changes in tree density after storms. The model flags damage patterns found in before-and-after aerial images. The data and analysis feeds into GIS maps decision makers can use to calculate repair costs and pinpoint resource allocation.
First responders are also using this powerful combination of GIS and AI, known as geospatial AI, to get in a better position during emergencies. Cox supplies rescue crews with smart maps that utilize geospatial-AI datasets. These can recognize lanes in parking lots, alleyways, and commercial spaces to bring first responders closer to people in need.
“It was something that we were able to generate en masse,” Cox explained about the map improvements. “It took a couple of weeks of cleaning up the geometry and adding attribute information, and then we serve it to the public and to Emergency Response partners. It represents a big advancement—providing that extra context that we didn’t have before.”
Just a few years ago, integrating those pathways into the first responders’ navigation systems seemed like a far-off possibility. “We couldn’t afford to do it,” said Scott Weisman, head of TLCGIS and a 31-year veteran of the program. “We would have to hire people to do that manually, and we never had the resources to do it—until now.”
Encouraging Experimentation
Cox’s path to geospatial innovation started 14 years ago when he was a fresh-faced temp with a new degree from the University of South Florida. Weisman brought Cox onto the team to help Leon County develop a faster, more accurate way to bill for solid waste and stormwater services. The work involved maintaining a large dataset—all the residential buildings in the county and relevant classifications for service rates. The data needed regular updates, edits, and audits.
A knack for geoprocessing earned Cox a full-time position. He expanded his scope to other large datasets that needed frequent checks and updates. For a time, he managed the record of all the addresses in the county.
Esri ModelBuilder and Python programming whet his appetite for automation. He devoured all the training and information he could find, eventually arriving at a blog post about the Building Footprint Extraction USA model. This early geospatial AI model could automate a key workflow—checking field images against recorded values in the dataset.
Cox wanted to experiment, but at the time, TLCGIS computers didn’t have the discrete graphics cards needed for early AI work. Using a gaming computer, Cox ran the model on an image of the entire 7,000-plus square miles of Leon County. It took four days to process but he found the feature output to be incredibly accurate.
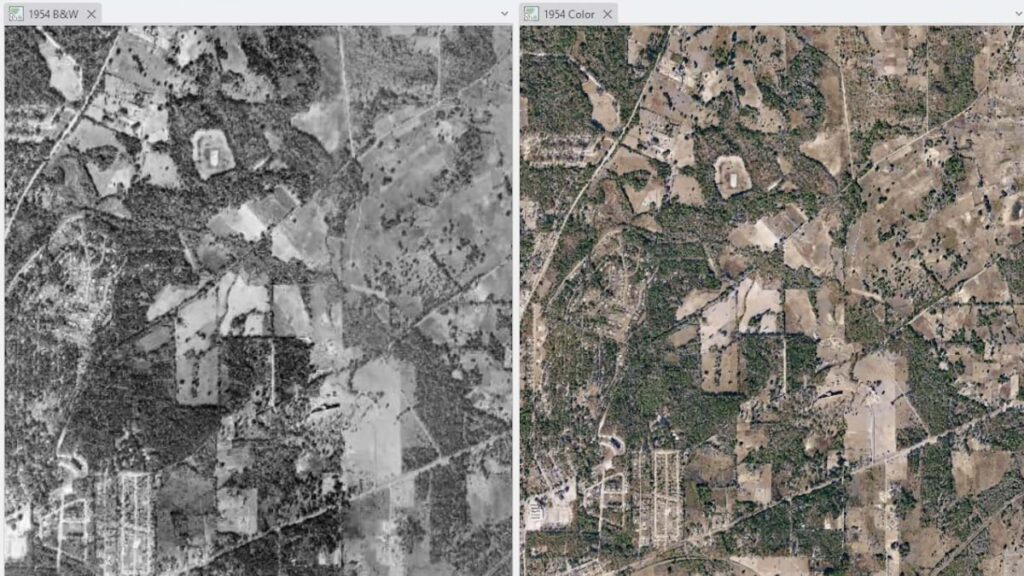
TLCGIS uses AI to colorize historical aerial images like this 1954 black and white photo (left) transformed into full color (right). This geospatial AI application helps historians and planners visualize how Tallahassee’s landscape has changed over decades.
Doing More with Less
The promise of AI-powered digital tools—to do more with less—is a familiar refrain for local government administrators. Often challenged to deliver services with reduced or stagnant budgets, officials look for ways to optimize. Over the years, TLCGIS laid the track for dozens of departments to innovate with location intelligence. With geospatial AI, Weisman and Cox have a work multiplier—an innovation high speed rail of their own.
Tallahassee’s recent AI-powered innovations join an already prodigious portfolio of projects:
Permit Finder integrates data from both the City and County permitting systems, offering a unified source for permit information. Users can access details on active permits, residential and non-residential permits, and specific data by entering a permit number or address. This consolidation streamlines the permitting process and enhances transparency.
The Flood Resource App (internal only) includes detailed basin data and layers related to flooding and storm surges. It is a crucial tool for planners and permitting offices, helping them make informed decisions about flood-prone areas and stormwater management. The app provides real-time information on water levels and potential flood risks, enhancing emergency preparedness and response.
The highly utilized Land Information App provides essential property-related information, such as ownership, zoning, and land use. It is a valuable resource for residents, businesses, and planners, offering detailed data that can be accessed easily and quickly.
The Emergency Operations Center (EOC) Dashboard (internal only) offers live data during emergencies, ensuring timely and informed decision-making. It features real-time maps of traffic accidents, road closures, and damaged buildings, which are critical for coordinating emergency response efforts and communicating with the public.
GIS Superpowers: Operationalizing Innovation
Few local GIS offices can boast such a well-executed set of public sector GIS apps and tools.
Even fewer take on the responsibility of creating content for their city’s bicentennial celebrations.
Weisman explained, only half in jest, that TLCGIS staffs a resident historian. Marcus Curtis is an expert GIS analyst and insatiable history buff. He built the History in Your Hands program for the 200th anniversary of the founding of the historic city in 2024. The map-guided exploration of Tallahassee neighborhoods garnered national media coverage and awards from historical societies. It brought about new and transformative connections.
“Marcus has reestablished plantation boundaries from old census maps and deeds,” Weisman said. “He’s catching the eye of real historians.”
Other staffers pair GIS and website development, or GIS with Adobe Creative Suite for print production.
Passion projects are part of an approach designed to raise the profile of TLCGIS across departments in Leon County. This visibility is crucial, given how Tallahassee-Leon County government is structured.
TLCGIS serves the City of Tallahassee, Leon County Government, and the county property appraiser. They also collaborate with state agencies and provide mutual aid to other counties when called upon. Program costs are shared between partners. The more the offices collaborate and drive value outside the program, its recognition grows and expands into new projects.
“One of the advantages of the structure we have in place—it includes an executive level, a steering committee, and a user group level,” Weisman explained. “Data sharing is streamlined because no memorandums of understanding are required. The trust within the program facilitates this process.”
The city employs other GIS professionals outside of TLCGIS. Weisman—and his dedicated team of 13 full-time employees and two interns—evangelize use of the technology and push the envelope of what GIS can do.
Weisman takes great care in curating the TLCGIS team, handpicking individuals who have demonstrated a deep passion and creativity in their work.
The formula keeps morale high and turnover low. “Everyone has what I call a superpower, a special skill—they are a subject matter expert,” Weisman said. “People who can dig into a particular topic and become experts in it.”
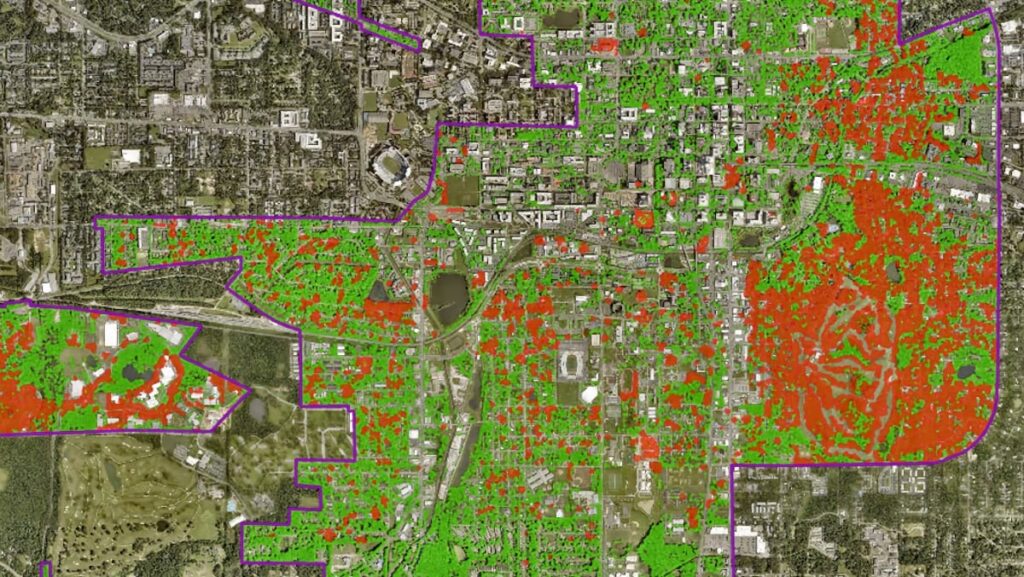
AI-generated tree damage assessment map shows storm impact patterns across Tallahassee. Green areas indicate healthy tree coverage while red zones highlight damage requiring attention. This automated analysis replaces months of manual field surveys with days of computer processing.
.